Technology
‘Optimum’s Technology helps view risk, volatility and portfolio design in a new light. Its complexity metrics provide superior market early-warning signals.
Making it the only company to offer complexity-based investment strategies.’
The Quantitative Complexity Management (“QCM”) has developed a modern measure of correlation – a generalized correlation – which accounts for non-linear aspects of data. The method is based on cognitive AI technology which treats data as images, emulating an expert looking at data. This is AI 2.0.
Generalized correlations capture interdependencies that classical techniques can miss. They also discard correlations that are identified mistakenly by conventional means.
Generalized correlations don’t require a cut-off value – the method naturally establishes which correlations are significant and which are not.
The method for the computation of generalized correlations has its roots in quantum physics and nonlinear mechanics. For more than a decade our technology is being used in defense, manufacturing and medicine.
When it comes to anticipating market crashes, our system doesn’t need to learn to recognize them. Training for anomaly detection requires numerous examples. In a non-stationary context, old examples may be irrelevant. Our complexity-based signals do not require training and function on a totally different basis.
What We Do With Data
Technology
Data is analyzed by emulating the brain as it ‘sees it’ in the form of images, without any math models. Models are only surrogates and they invariably destroy and warp information, constituting an additional source of risk. The model-free approach does not have this drawback.
Read more


Portfolio Complexity Maps
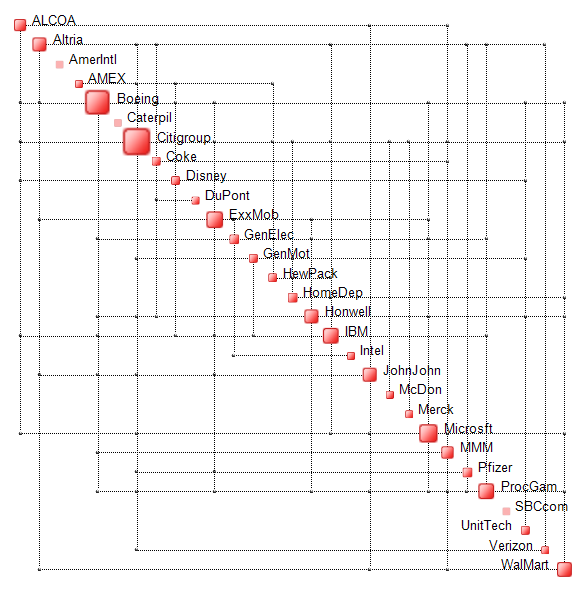
Below is an example of a Portfolio Complexity Map. The map contains only the relevant inter-dependencies between stocks composing the portfolio thereby reflecting its true structure. Stocks having a dominant complexity footprint on the portfolio – the Complexity Drivers – are indicated via the larger boxes on the map’s diagonal.
Read more
Each portfolio can only reach a specific maximum value of Complexity called “Critical Complexity”.
Close to its Critical Complexity, a portfolio becomes fragile and should be restructured to remove its Complexity Drivers.
Prior to a crisis portfolio complexity tends to fluctuate rapidly. Complexity spikes constitute formidable early-warning signals.

