Technology
Data is analyzed by emulating the brain as it ‘sees it’ in the form of images, without any math models. Models are only surrogates and they invariably destroy and warp information, constituting an additional source of risk. The model-free approach does not have this drawback.
Optimum utilizes a measure of correlation which better reflects the level of risk associated with an individual company, portfolio of companies or any financial instruments or asset classes.

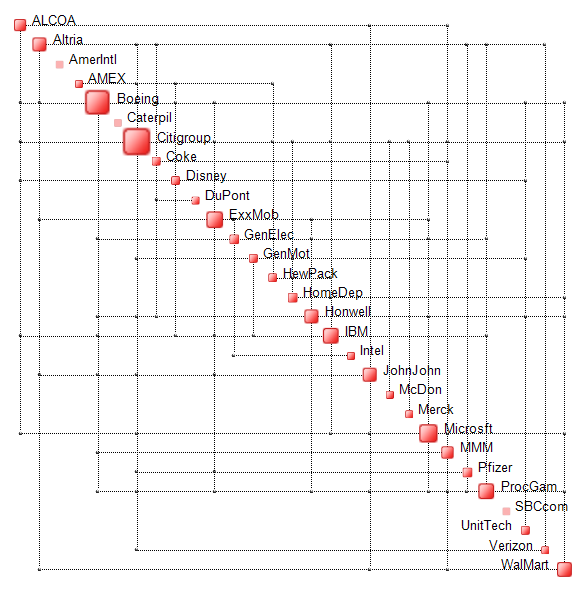
Visual Analytics – Cognitive Artificial Intelligence: data is analyzed by transforming scatter plots to images.
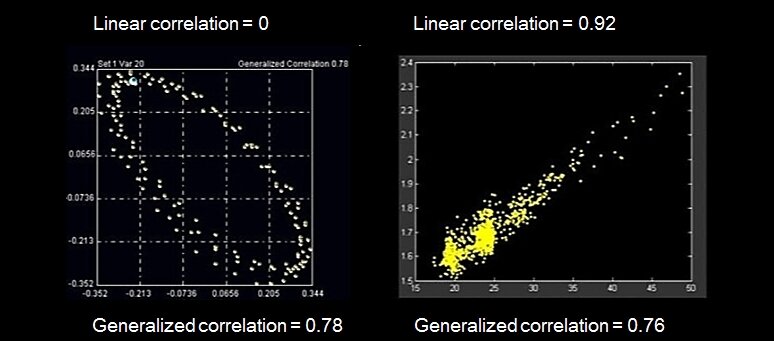
Popular Pearson’s correlations work well in linear contexts. In cases of clustering, bifurcations or discontinuities, applying linear correlations is outright wrong. Linear correlation analysis may induce unjustified optimism and distort significantly any risk-type calculations.
Examples are illustrated below.

Generalized correlations yield more realistic values of correlation and can capture inter-dependencies which linear techniques miss.
The surprising fact is that this shortcoming of linear correlations is known but neglected by the mainstream of fund managers and analysts.
Generalized correlations lie at the heart of measuring the complexity of stocks, portfolios, funds or corporations. The new information and insight which complexity quantification brings makes it possible to radically rethink asset selection, risk management and portfolio design.

